
TL;DR Summary
A rules-based investment process replaces gut-feeling decisions with quantitative data and systematic scoring. Every morning, our team reviews gamma exposure, high-yield credit spreads, volatility skew, tick data, and net liquidity before markets open. Each security passes through four scoring filters — Trade, Trend, Signal, and Strength — before capital is committed. Every signal is backtested across approximately two thousand securities and multiple market regimes. The result is a repeatable framework where portfolio decisions are driven by measurable criteria, not market headlines or emotional reactions.
What Is a Rules-Based Investment Process?
A rules-based investment process is a systematic method of managing portfolios where every decision — what to buy, when to buy it, how much to allocate, and when to exit — is governed by predefined, measurable criteria rather than discretionary judgment. The approach removes emotional decision-making from the equation and replaces it with quantitative signals, backtested frameworks, and structured scoring.
This matters because the gap between what investors earn and what the market delivers remains stubbornly wide. DALBAR — the Quantitative Analysis of Investor Behavior study, published annually since 1994 — is the industry’s benchmark for measuring this gap. In its 2025 report covering calendar year 2024, the average equity investor earned 16.54% while the S&P 500 returned 25.02%, a shortfall of 848 basis points (DALBAR QAIB, 2025). That was the second-largest gap of the past decade.
The 2026 report offered a rare bright spot: the investor gap narrowed to just 72 basis points in 2025, with the average equity investor earning 17.16% against the S&P 500’s 17.88% (DALBAR QAIB, 2026). But the long-term pattern is clear — emotional, reactive trading consistently erodes returns. A rules-based process is designed to close that gap by making discipline structural rather than aspirational.
The Daily Data Stack: What We Monitor Before Markets Open
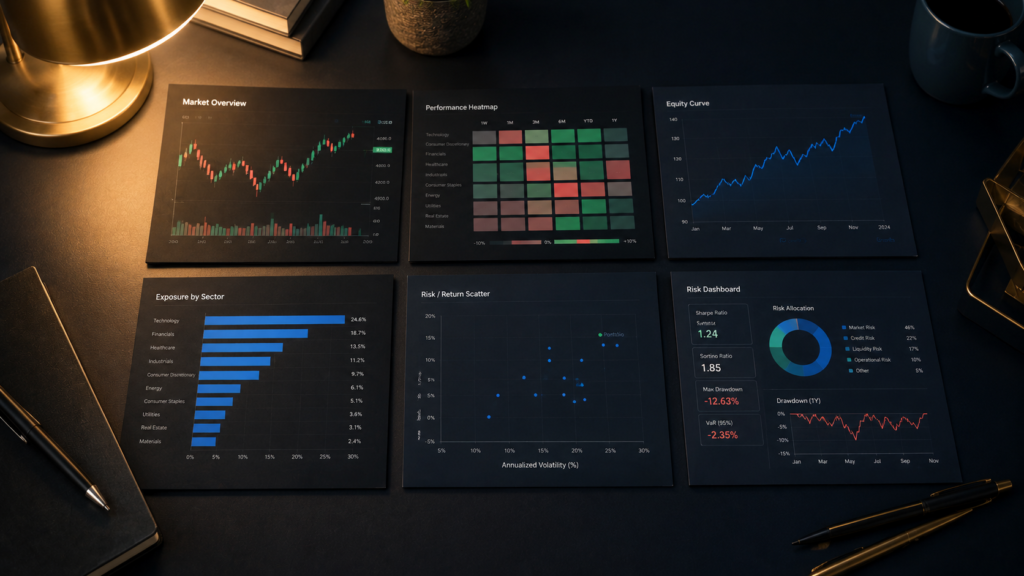
At a rules-based advisory firm, the trading day starts long before the opening bell. The data we review every morning forms the foundation that all downstream decisions are built on. This is not a cursory headline scan — it is a structured review of market mechanics that most investors never see.
Gamma Exposure (GEX)
Gamma exposure measures how options dealers are positioned and how their hedging activity will affect price movement. When dealers hold net positive gamma, their hedging dampens volatility — they sell into rallies and buy into dips, acting as a shock absorber. When gamma flips negative, the opposite occurs: dealer hedging amplifies price movement in both directions (SpotGamma, 2026).
This is not an abstract concept. Zero-days-to-expiry options now account for 59% of all S&P 500 options volume, up from approximately 5% in 2016 (Cboe Global Markets, 2026). That means dealer hedging flows have become one of the most powerful short-term forces in equity markets. Monitoring gamma exposure tells us whether the market is in a stabilizing or destabilizing regime before our clients’ portfolios are affected.
High-Yield Credit Spreads
High-yield credit spreads measure the difference in yield between corporate junk bonds and risk-free Treasuries. When spreads widen, the bond market is pricing in higher default risk — a leading indicator that equity markets tend to follow. We track the ICE BofA US High Yield Index spread (BAMLH0A0HYM2) daily through FRED. When credit stress emerges in the bond market before it shows up in stock prices, we adjust positioning accordingly.
Volatility Skew
The CBOE SKEW Index measures how the options market prices tail risk — specifically, the premium investors pay for deep out-of-the-money put protection relative to equivalent call speculation. Elevated skew signals that sophisticated market participants are paying up for downside protection, even when headline volatility appears calm. We use skew as an early warning system for sentiment shifts that surface data reveals before price action does.
Tick Data (NYSE TICK)
The NYSE TICK index measures real-time buying versus selling pressure across all NYSE-listed stocks. Each reading captures the net number of stocks trading on an uptick minus those on a downtick at any given moment. Extreme readings — above +1,000 or below −1,000 — indicate broad institutional buying or selling. We monitor tick data intraday to gauge execution timing and breadth participation.
Net Liquidity
Net liquidity tracks the effective flow of money through the financial system using a straightforward formula: Federal Reserve balance sheet (WALCL) minus the Treasury General Account (WTREGEN) minus overnight reverse repurchase agreements (RRPONTSYD). When net liquidity expands, risk assets tend to rise. When it contracts, they face headwinds.
This relationship has been well-documented. The rolling correlation between net liquidity and the S&P 500 peaked at 0.94 during the COVID-era quantitative easing cycle (Eco3min, 2026). While that level was period-specific and the correlation is not stable across all regimes, the directional relationship remains a meaningful input. Citi Wealth noted in its 2026 outlook that liquidity shifts “underneath the surface can help drive market directionality” and called the current environment “an inflection point” (Citi Wealth, 2025).
Answer Block: What Is a Rules-Based Investment Process?
A rules-based investment process is a portfolio management approach where every buy, sell, and sizing decision is governed by predefined quantitative criteria. Signals are generated by systematic models — not human judgment — and each signal must be backtested across multiple market environments before it is deployed. The goal is to make investment discipline structural, removing emotion from the decision chain entirely.
Traditional Advisor vs. Rules-Based Process: A Comparison
Research consistently shows that clients move from ‘intending’ to create an estate plan to actually hiring an attorney when a specific life event creates immediate urgency. Here are the seven most common triggers.
The Four Pillars: Trade, Trend, Signal, and Strength
Every security in our investment universe passes through four independent filters before it earns a position in a client portfolio. Each pillar scores a binary +1 or −1 based on clear, measurable criteria. There is no gray area and no override.
Step 1 — Trade (Entry Filter): Before any capital is committed, the security must meet a predefined technical setup. This means the entry conditions we are looking for must be present in the data. If the setup does not exist, the trade does not happen — regardless of what headlines, sentiment, or analyst commentary suggest.
Step 2 — Trend (Direction Filter): We measure whether the security is trending up, down, or sideways using quantitative technical indicators. We only position capital in the confirmed direction of the trend. This is not a forecast — it is a measurement of what the price is actually doing right now.
Step 3 — Signal (Timing Confirmation): Before execution, our signal models must independently confirm the trade. These models are systematic and fire based on price action and indicator convergence, not discretionary opinion. A clean signal keeps us out of noise and false breakouts.
Step 4 — Strength (Conviction Sizing): When Trade, Trend, and Signal all align, that is a full-conviction position and receives meaningful capital allocation. When alignment is partial, position size is reduced proportionally. When alignment is absent, we stay out entirely.
The composite score ranges from −4 to +4. A +4 represents maximum conviction across all four pillars. Positions ranked highest receive the most capital; positions further down the list are held at minimums or trimmed.

Backtesting: How We Validate Every Signal
No signal enters our system without being backtested. This is not a one-time exercise run in favorable market conditions to confirm a thesis. Our backtesting process is designed to stress-test signals across the full spectrum of market environments.
What our backtesting process covers:
- Universe of approximately 2,000 securities across sectors, market caps, and asset classes
- Multi-regime testing: signals must hold through the 2008 financial crisis, the 2020 COVID selloff, and the 2022 rate shock
- Evaluation of both entry and exit performance — not just win rate but risk-adjusted return
- Drawdown analysis: understanding how deep and how long a signal underperforms before recovering
- Signal removal: any signal that fails under stress conditions is eliminated from the system
- Composite score validation: testing whether the four-pillar scoring framework improves risk-adjusted performance versus individual signals alone
The output is a ranked buy list where every security has a composite score. The highest-ranked names receive the most capital, and the system rebalances when the underlying data changes — not on a fixed calendar.
Key principles of our backtesting philosophy:
- Signals that worked in one favorable environment are not sufficient — they must work across multiple regimes
- Fewer trusted signals outperform a dashboard full of indicators that fail under stress
- Backtesting is continuous — signals are re-evaluated as new market data accumulates
- Parameter optimization is avoided to prevent overfitting — the goal is robustness, not perfection
Results are measured against buy-and-hold benchmarks to ensure the process adds genuine value
Answer Block: What Does Backtesting Mean for Investment Signals?
Backtesting is the process of applying an investment signal to historical market data to evaluate how it would have performed across different environments. A rigorous backtest covers multiple market regimes — bull markets, bear markets, high-volatility corrections, and recovery periods — across a broad universe of securities. Signals that fail under stress are removed. The goal is to deploy only signals with demonstrated robustness, not signals that happened to work in favorable conditions.
Why the Market Structure Has Changed — and Why It Matters
The market your portfolio operates in today is structurally different from the one that existed even five years ago. Understanding these shifts is essential context for why a rules-based process is no longer optional — it is necessary.
The single biggest structural change is the dominance of zero-days-to-expiry (0DTE) options. In 2016, 0DTE contracts represented roughly 5% of S&P 500 options volume. By 2024, that figure had reached 47% (Cboe, 2024). In 2025, it jumped to 59% — an average of 2.3 million contracts per day (Cboe Global Markets, 2026). Across all U.S. listed options, 0DTE now accounts for 24.1% of total volume, nearly double its 2022 share (OCC/Cboe, 2026).
This explosion in short-dated options means that dealer hedging flows — the mechanical buying and selling that market makers do to stay delta-neutral — have become the single most powerful intraday force in equity markets. When dealer gamma flips from positive to negative, volatility can expand rapidly as hedging becomes pro-cyclical: dealers sell into falling markets and buy into rising ones, amplifying moves in both directions (SpotGamma, 2026).
For investors who rely on traditional buy-and-hold or quarterly rebalancing, these intraday dynamics are invisible. For a rules-based process that monitors gamma, skew, and tick data in real time, they are actionable intelligence.
From Ranking to Allocation: How the System Builds Your Portfolio
Once every security has been scored through the four-pillar framework and backtested signals have generated a composite ranking, the system moves to portfolio construction. This stage is where the ranked buy list becomes actual capital allocation.
Top-ranked securities — those with full +4 composite scores and the strongest signal alignment — receive the largest capital allocations. Securities ranked in the middle tiers receive proportionally smaller positions. Securities at the bottom of the ranking are held at minimum allocations or trimmed entirely.
Rebalancing is driven by changes in the underlying data, not by a fixed schedule. When signals shift — a trend reversal, a change in gamma regime, a deterioration in credit spreads — the rankings update and the portfolio adjusts. This means the portfolio is always calibrated to current conditions rather than stale quarterly reviews.
The result is a portfolio where every position has a quantitative reason for being there, at the size it is, and where the exit criteria are predefined before the entry is made.
Frequently Asked Questions
What is a rules-based investment process and how is it different from traditional investing?
A rules-based process uses predefined quantitative criteria for every investment decision. Unlike traditional advisory where a committee or individual makes discretionary calls based on research and judgment, a rules-based system scores each security through systematic filters. The process runs identically regardless of market conditions, removing emotional bias from portfolio decisions.
What kind of data does a quantitative advisor review every day?
A quantitative advisor typically monitors gamma exposure, high-yield credit spreads, volatility skew, tick data, net liquidity, Treasury yields, and commodity prices before markets open. These data points reveal how options dealers are positioned, whether the bond market is pricing in stress, and whether institutional buying or selling pressure is building.
How does gamma exposure affect my investment portfolio?
Gamma exposure determines whether options dealer hedging will stabilize or amplify market moves. With 0DTE options now accounting for 59% of S&P 500 volume, dealer hedging has become a dominant short-term market force. Advisors who monitor gamma can anticipate whether the market is in a stabilizing or destabilizing regime.
What does backtesting mean and why should I care about it?
Backtesting applies an investment signal to historical data across multiple market environments to verify it performs under stress. It matters because signals that only work in favorable conditions provide false confidence. Rigorous backtesting across regimes like 2008, 2020, and 2022 ensures signals are robust before they touch your portfolio.
How does a rules-based advisor decide how much of each stock to buy?
Position sizing is determined by composite signal conviction. Each security scores +1 or −1 across four filters. A perfect +4 score receives full-conviction sizing. Partial alignment receives proportionally smaller positions. Zero or negative alignment means the position is held at minimums or excluded entirely.
Can a rules-based investment process work during a market crash?
Yes — in fact, rules-based processes are designed for exactly these conditions. The system runs identically whether markets are calm or volatile. Signals that fail during stress testing are removed before deployment. The process also reduces exposure systematically as conviction scores decline, rather than waiting for a human to decide when to sell.
How is this different from algorithmic or high-frequency trading?
Rules-based investing uses systematic scoring for portfolio allocation decisions on a daily or weekly timeframe. High-frequency trading executes thousands of trades per second to capture microsecond price discrepancies. The goals are fundamentally different: rules-based investing builds long-term portfolios; HFT exploits short-term market microstructure

Works Cited
- DALBAR, Inc. “Investors Missed the Best of 2024’s Market Gains.” DALBAR QAIB. March 31, 2025. https://www.dalbar.com/qaib/
- DALBAR, Inc. “DALBAR’s 2026 QAIB Report Shows Narrower Investor Gap.” PR Newswire. April 17, 2026. https://www.prnewswire.com/news-releases/dalbars-2026-qaib-report-shows-narrower-investor-gap-amid-a-complex-and-volatile-market-year-302745998.html
- SpotGamma. “Gamma Exposure (GEX).” SpotGamma. March 14, 2026. https://spotgamma.com/gamma-exposure-gex/
- Cboe Global Markets. “Cboe Reports Trading Volume for December and Full Year 2025.” Cboe. January 2026. https://ir.cboe.com/news/news-details/2026/Cboe-Global-Markets-Reports-Trading-Volume-for-December-and-Full-Year-2025/
- Cboe Global Markets. “The State of the Options Industry: Quarter Three 2025.” Cboe. October 29, 2025. https://www.cboe.com/insights/posts/the-state-of-the-options-industry-quarter-three-2025/
- Traders Magazine. “VOL REPORT: 0DTE, FLEX Options Are 2025 Heroes.” February 19, 2026. https://www.tradersmagazine.com/vol-report/vol-report-0dte-flex-options-are-2025-heroes/
- Eco3min. “The Liquidity Illusion — Net Liquidity Index (2003–2026).” May 2026. https://eco3min.fr/en/net-liquidity-index-dataset/
- Citi Wealth. “Liquidity: A Subtle Support for 2026.” December 10, 2025. https://marketinsights.citi.com/Market-Commentary/Weekly-Market-Update/Liquidity-a-Subtle-Support-for-2026.html
- BlackRock. “Ceding Balance Sheet Control.” October 27, 2025. https://www.blackrock.com/us/individual/insights/balance-sheet-liquidity
- Schwab. “2026 Long-Term Capital Market Expectations.” March 16, 2026. https://www.schwab.com/learn/story/schwabs-long-term-capital-market-expectations
- Trustnet. “Six Lessons for 2026: What 2025 Taught Us About Evidence-Based Investing.” January 21, 2026. https://www.trustnet.com/news/13467965/
- Kirr Marbach. “Investors Snatch Defeat from Jaws of Victory, Yet Again.” October 3, 2025. https://kirrmar.com/ibj-oct-3-25/